Line Charts Project
The main purpose of this project is to learn how to make line charts in Microsoft Excel.
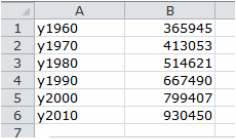
Use the information below to create a line chart about the population changes in Fresno County.
Use the information below to create a line chart about the population changes in Fresno County.
Instructional Video #1
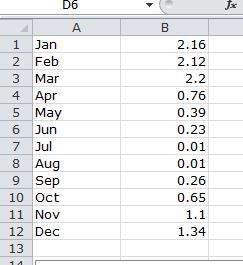
Use the information below to create a line chart about the monthly precipitation in Fresno.
Instructional Video #2
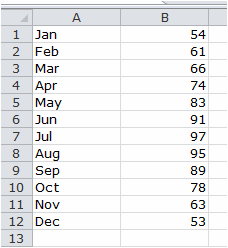
Use the information below to produce a line chart about the monthly average high temperature in Fresno.
Instructional Video #3